


VertiGIS Studio Web Mapping for Urban Heat Map Viewer
Background
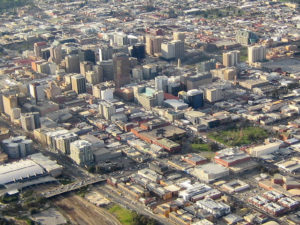
As our climate changes, heatwaves are getting hotter, longer and more frequent. Urban areas already suffering from the heat island effect will bear the brunt of these harsher heat events.
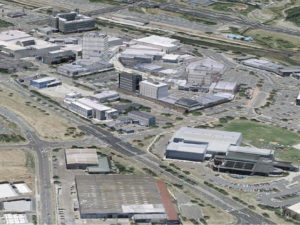
Urban heat islands are areas of the urban environment that are significantly warmer than the surrounding landscape. In particular, areas with a larger thermal mass of non-climate-sensitive structures, such as concrete or bitumen, result in higher surface temperatures compared to parklands or vegetated areas. Concerns about the effects of urban heat islands are growing, especially because of the potential impacts on vulnerable members of the community. These negative effects are exacerbated by climate change.
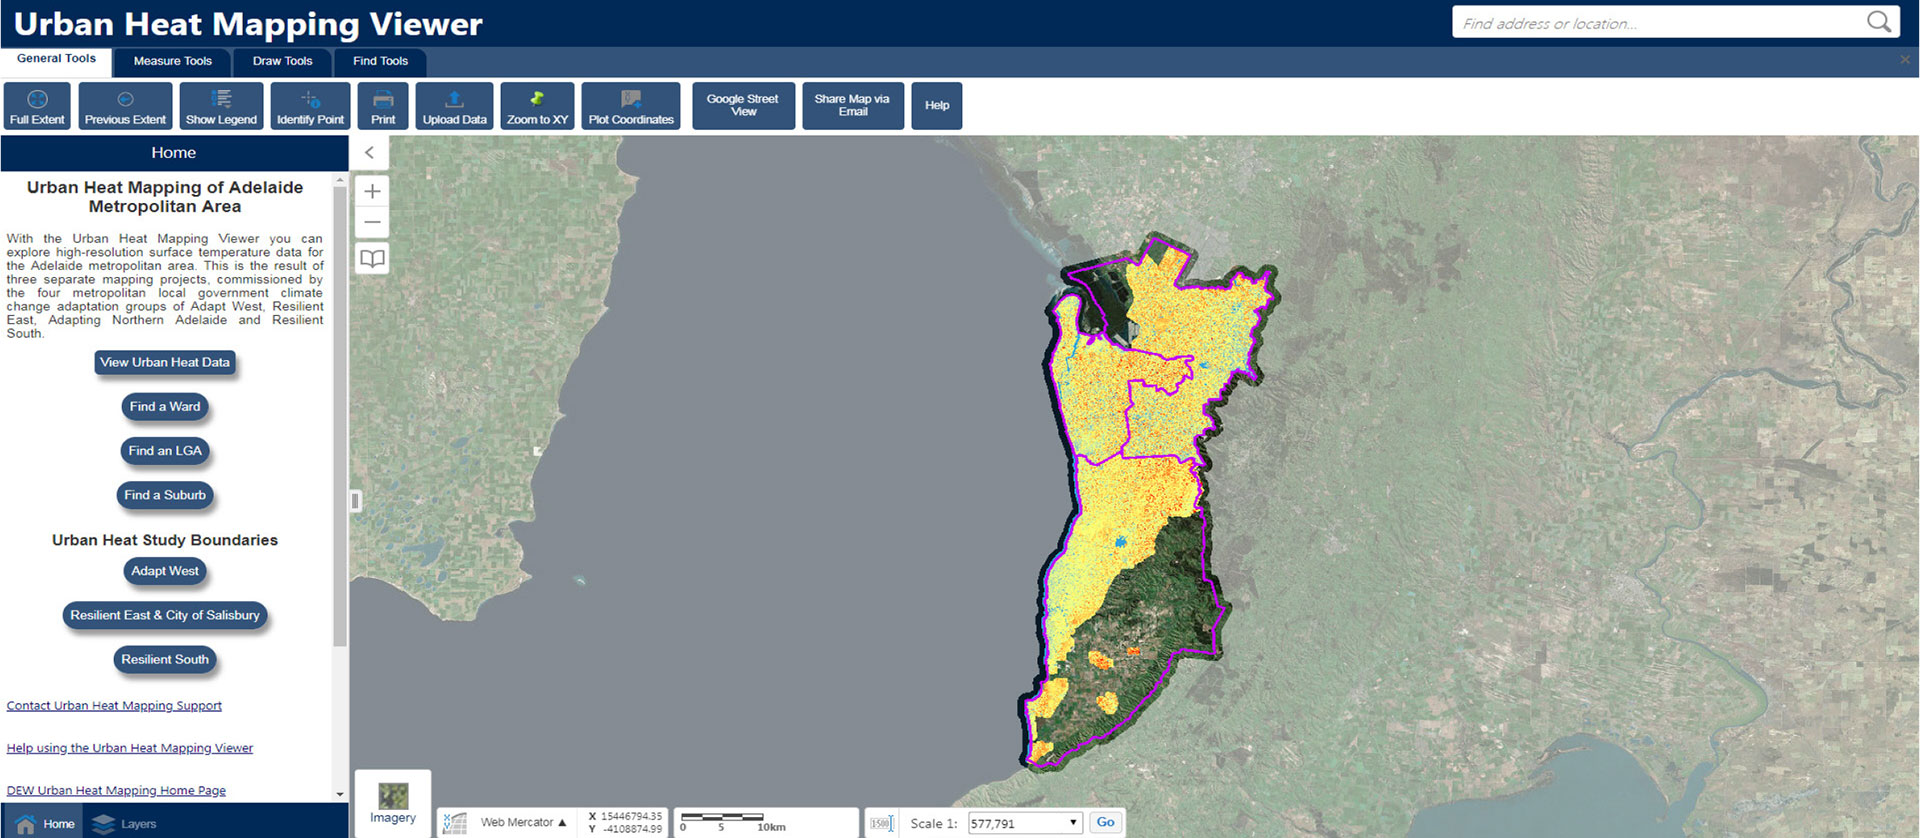
The South Australian Department for Environment and Water (DEW), in partnership with four metropolitan local government climate change adaptation groups, created an Urban Heat Mapping Viewer to explore high-resolution surface temperature data for the Adelaide metropolitan area.
The Challenge
Local South Australian Government Associations from Resilient South, Adapt West, Resilient East and Adapting Northern Adelaide climate change adaption initiatives partnered to map heat and vegetation health in their suburbs to identify areas most at risk. Three separate projects were undertaken in three different years to capture this data. These three thermal datasets collectively cover approximately 95% of the Metropolitan Adelaide Region. The challenges were:
- Consolidating the data from the 3 studies into one central location;
- Creating a simple, easy-to-use web-based map viewer that local councils and the general public could use. They needed to view their selected area’s urban heat data in a timely manner;
- Creating a mapping tool that could be viewed across multiple platforms;
- Allowing users to easily find an address or location; and
- Enable users to “fade” thermal data to see the underlying basemap details eg: aerial imagery and land use.
The Solution
DEW has a long history with AAM and using VertiGIS products to develop internal and external mapping applications. AAM advised that the core mapping functionality and flexible workflow tools from Geocortex Essentials provides a stable base from which to build, configure and style a publically accessible HTML5 viewer. The recently developed Urban Heat Mapping Viewer enables the user to explore high-resolution surface temperature data for the Adelaide metropolitan area.
To build the Urban Heat Mapping viewer:
- DEW coordinated with local councils to host the 3 separate data sets and consolidate them in one central online mapping application;
- AAM helped to develop and implement VertiGIS Studio workflows to create ‘quick’ search tools that allowed users to find locations such as suburbs, Local Government Areas (LGA) and Property Parcel IDs;
- CSS styling allowed DEW to customise and brand the Viewer; and
- A number of “out of the box” tools were added to increase the overall usability and functionality of the Viewer.
The Results
The Urban Heat Mapping Viewer made data publicly available and supports decision-making on climate change assessment and mitigation. It also informs decisions on city planning and emergency response. This project has provided a foundation dataset for future monitoring of urban heat islands in Adelaide.
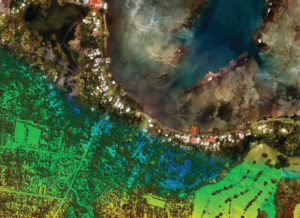
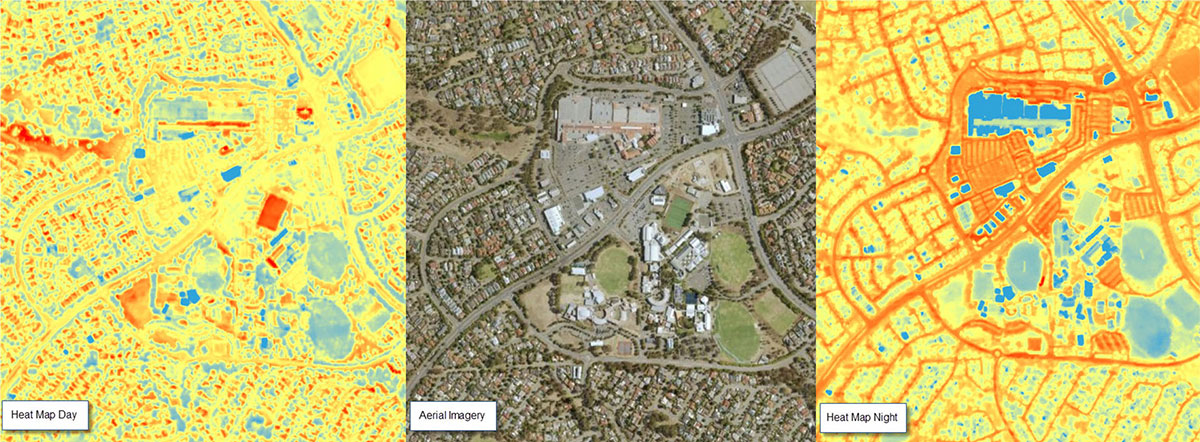
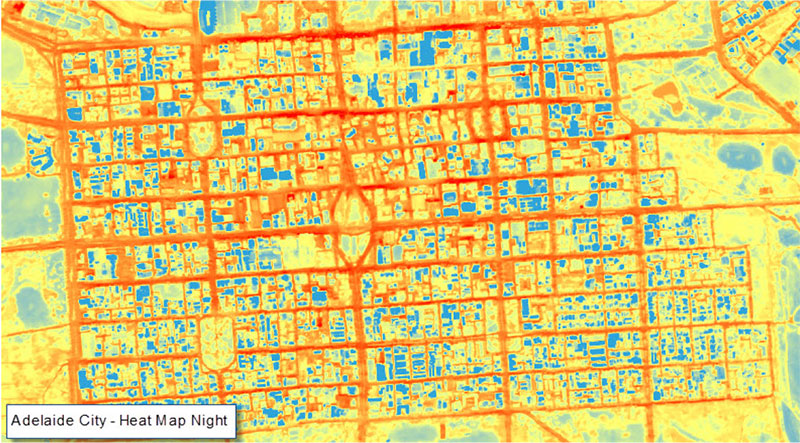
Through viewing the day or night thermal data, the user can clearly see the difference in temperature between:
- dark vs light coloured rooves
- street comparisons – green street vs non-planted
- irrigated vs non-irrigated parklands
- artificial turf vs lawn
- artificial playground surfaces vs pine chips
The data presented can be used to:
- Evaluate how urban infrastructure choices affect the temperature characteristics and extents of urban heat islands;
- Plan activities, such as street scaping, to mitigate high temperatures throughout the urban environment; and
- Make more informed asset management decisions by taking into account extreme heat and prolonged heat events. This bolsters community resilience.
The heat maps will be updated periodically, so that the effectiveness of climate change adaptation measures can be evaluated. The heat map also enables proactive investment in urban greening and climate-sensitive infrastructure.
“Authorities will use the resource to target more tree planting and designing infrastructure such as roads, shelters and playgrounds to minimise so called urban heat islands and counter rising temperatures caused by climate change.
It will also allow authorities to determine residents who may be at a higher risk of heat-related deaths.”
Hot in the City – Urban heat mapping reveals Adelaide’s hottest and coolest suburbs, Adelaidenow.com.au, Feb 7th 2018
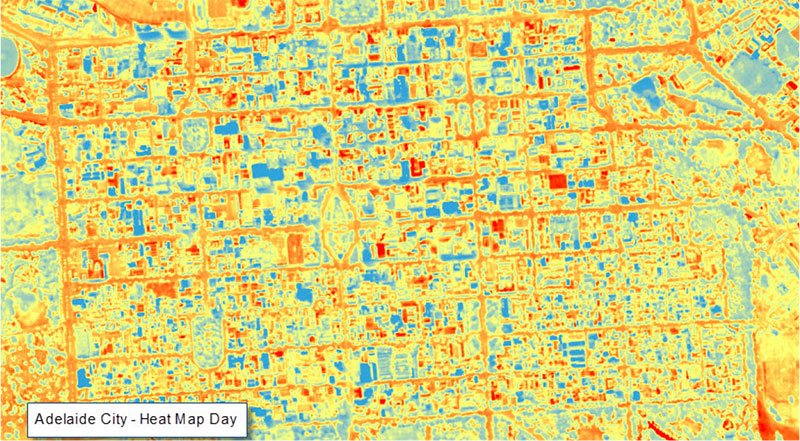
“With the use of daytime and nighttime thermal datasets, the mapping tool clearly shows the difference in temperature with the use of dark and lights colours – deep red for areas of extreme heat and blue for cooler areas,”
Department for Environment and Water Group Executive Director of Science, Feb 15th 2018